Last week, The 21stCentury School Fund along with Cooperative Strategies and the Urban Institute, released a Study of Enrollment Projections for D.C.’s Public Schools: Assuring Accuracy and Transparency. The study, produced under contract with the Office of the DC Auditor, analyzed the District’s current methods for projecting enrollment, evaluated the accuracy of past projections, and produced new five- and ten-year baseline enrollment projections for all DCPS and District charter schools. The following is a brief review the study team’s findings.
Analysis of Current Methods
Both DCPS and charter schools start with the “cohort method” to project next-year audited enrollment. Past trends in grade-to-grade cohort ratios are used to help predict future enrollment. For example, if on average over the past three years, the 1stgrade classes at a school were 90% of the size of previous year Kindergarten classes, then a current Kindergarten cohort 45 students would be predicted to enroll about 41 first grade students the next year. This is done based on the “cohort survival” ratio for each grade to create a baseline enrollment projections. But history, while a good indicator of the future, is NOT the future and both DCPS and charter schools make adjustments to these baseline projections based on school-level knowledge and expertise about changes that may affect the baseline projection. To reconcile individual LEA projections, the Office of the Deputy Mayor for Education certifies all enrollment projections and submits them for the Mayor’s development budget team in the spring.

Evaluating Past Projections
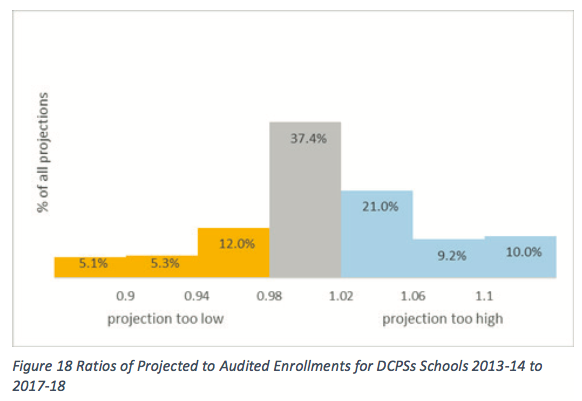
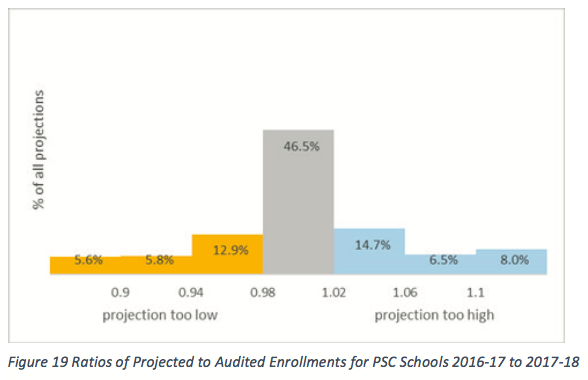
The study team looked at the accuracy of recent next year projections by comparing the school and grade projections to audited enrollment (P/E). The team found that with projections developed in the spring for next year’s budgets, roughly 37% of DCPS school-level projections and 47% of charter school-level projections were within +/- 2% of October audited enrollment.


Accuracy varied by Ward: projections for Ward 2, 3 and 6 schools were more likely to be accurate than schools located in Wards 5, 7 and 8. The study team found that DCPS schools with inaccurate projections often had highly mobile student populations – meaning many students enrolled or withdrew from the school year-to-year. Charter schools with sudden changes in capacity also saw more inaccurate projections.
New Five- and Ten-Year Projections
The team also produced 3 different types of projections—one that was baseline, which rolls up the individual school by grade cohort survival projections; the second which is a system-wide projection, which applies the citywide cohort survival by grade; and the third which totals children by high school boundary area and grade and applies the cohort survival to students by their residence. These projections, without any adjustments for educational improvements or new housing developments, expansion of early childhood or adult education, indicate that the District should see growth of more than 12,000 new students in the coming decade, particularly at the middle- and high-school levels. Check out your school’s baseline projection here on our online dashboard: http://dcauditor.wpengine.com/dc-enrollment-dashboard/ Remember that the projections reflect history of births and cohort survival, but when capacity of school buildings change, or boundaries change, or schools are opened or closed so they affect a neighboring school, the history does not capture this. This is why the adjustments POST baseline projections are so important.
Stay Tuned …
In the coming weeks, we’ll outline specific findings for each DCPS feeder pattern, the mobility indices used in the study, and why system-wide reforms may help produce a more efficient, transparent and timely process. Stay tuned!

No Comments